Insight & Foresight
Exploring predictive AI/ML capability across research planning and customer journeys
Leading B2B bioscience provider of research products
Trusted by global researchers via validation data, peer reviews and citations
~750,000 researchers / ~100K products / ~130+ countries
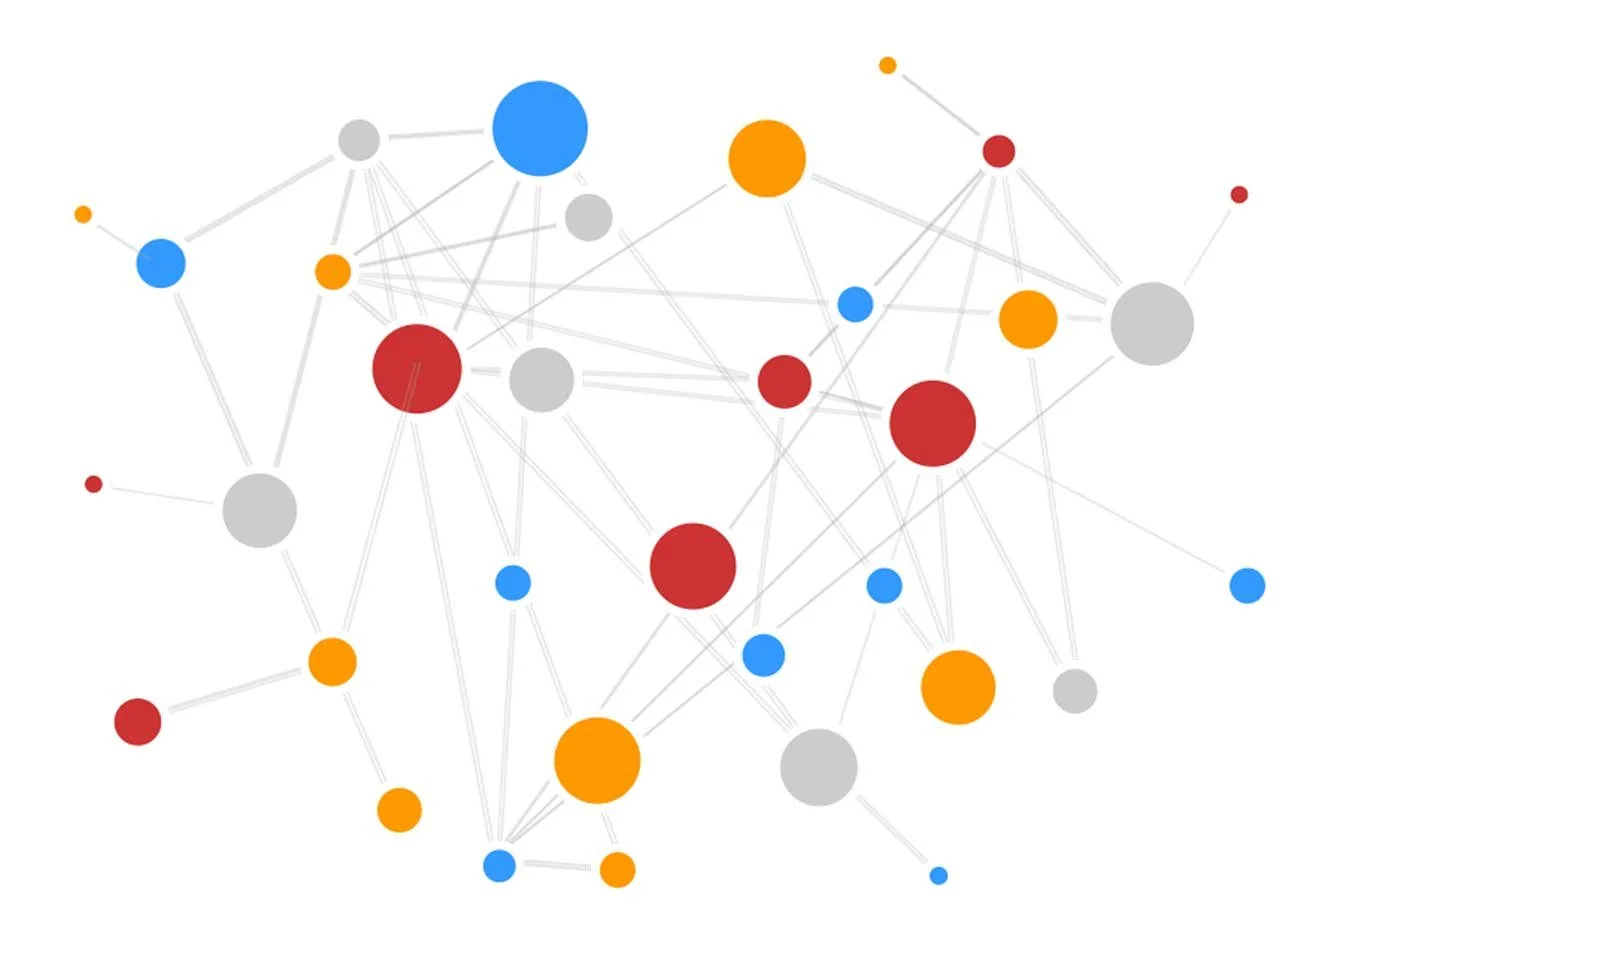
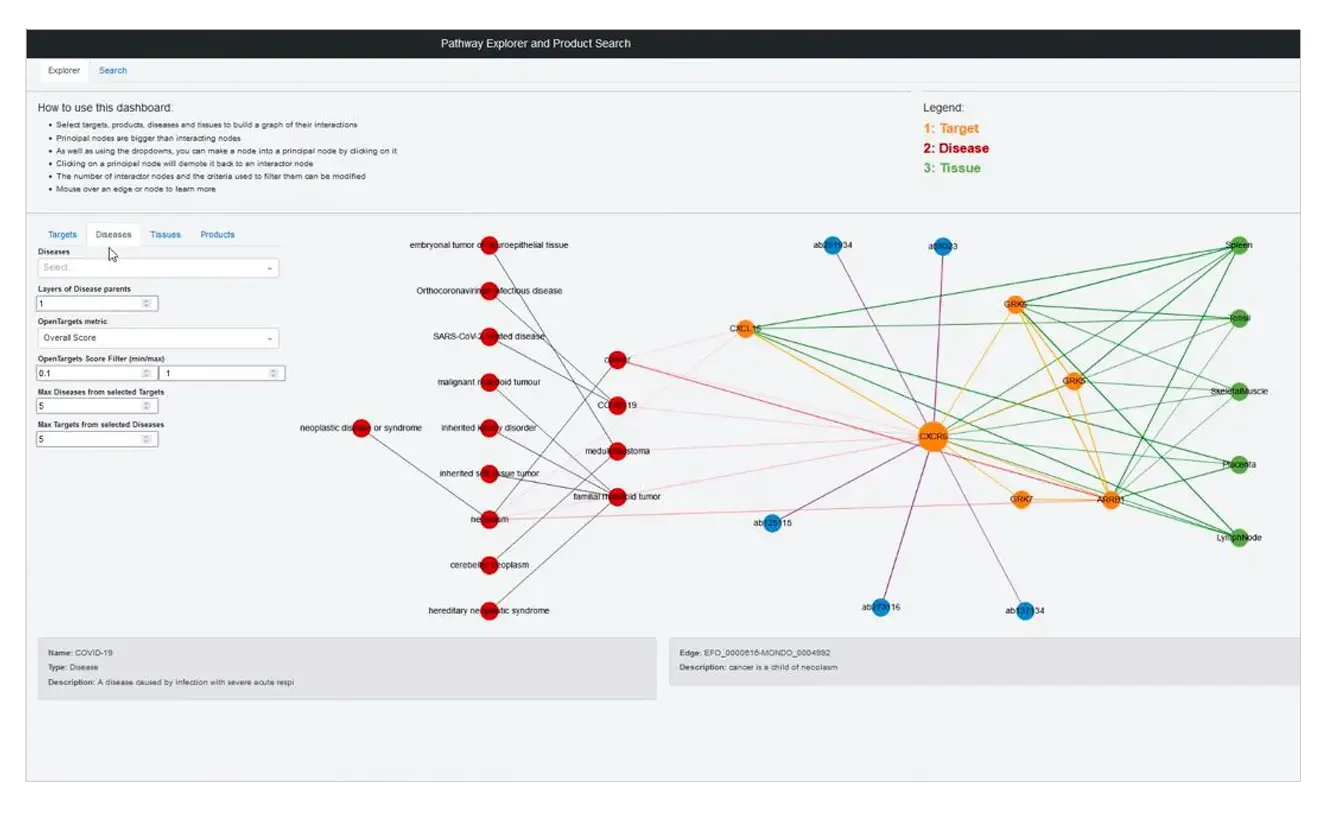
“Graph UI - Complex data visualisation, enabling future trends and outcomes.”
Overview
Data Science, UX and Product Management collaboration: Exploring a predictive ML Graph UI that integrates into customer journeys, using experiment attributes to surface relevant products and adjacent protein pathways, highlighting future areas of study. Assessement of how to scale and introduce new customer capability without disrupting existing revenue-critical journeys.
Partnered with Data Science leadership to align strategy and customer experience requirements
Developed customer user flow concept - scaling from one to a collections of tools
Explored POC UI alongside Data Science & Design Ops
Conducted stakeholder engagement and risk assessment for search conversion impact
Collaborated with Product Management and Engineering on POC refinement
Advocated for success metrics and phased integration to de-risk existing primary revenue journeys
Customer time challenge
Time-limited research grants, creating a high-pressure environment to get published
Planning, identifying products, execution, results analysis, abstracts and citations all take time
Discovery involves navigating large catalogues of products and data
Complex protein associations can be prone to missed opportunities
Objectives
Leverage ML graph UI tool to identify associations between products for experiment planning
Simplify and accelerate complex product exploration
Prototype journeys using Graph-UI to explore planning phase, and potentially product decisions
Why predictive modelling
Customer: Single antigens can lead into multiple pathways, simplifying analysis and product choice changes the ‘getting published’ timeframe
Business: Predicting demand early enables investment ahead of the curve
Key outcomes at a glance
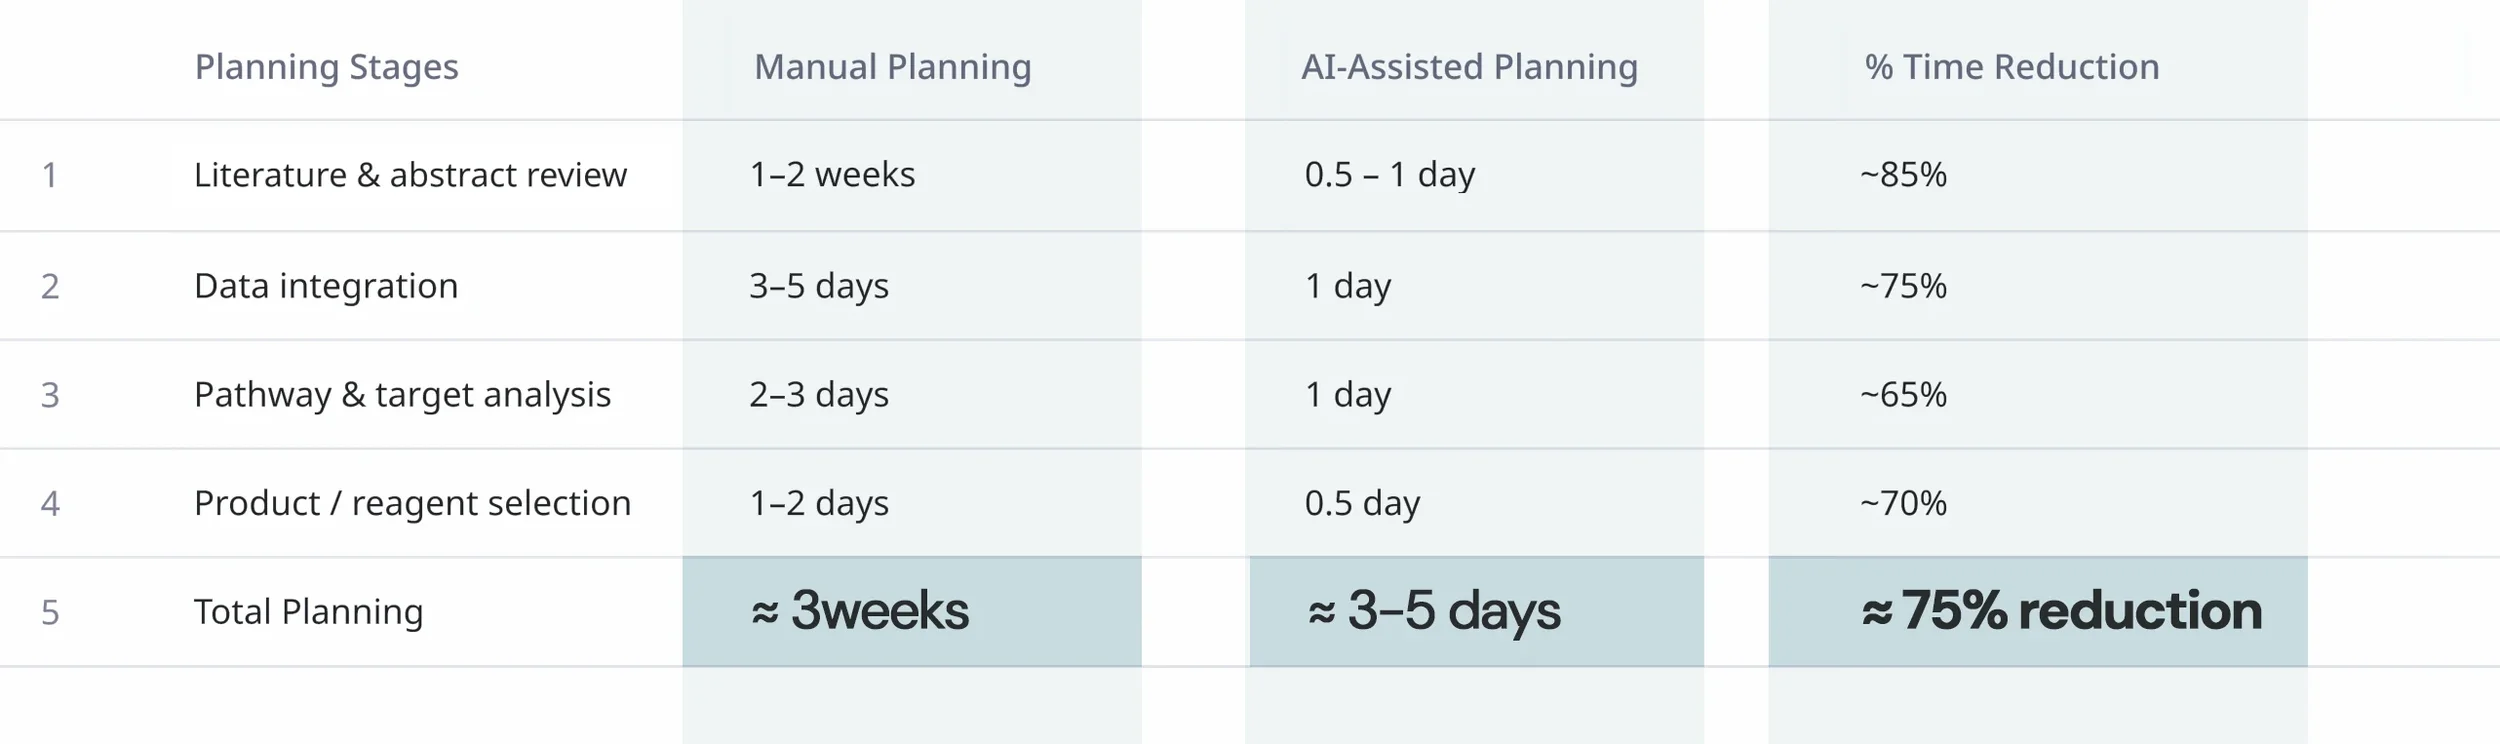
75% average reduction in planning time / ~3 weeks → ~3–5 days
First venture into exploring a future digital product portfolio alongside traditional manufacturing
POC of predictive analytics powering customer journeys to identify future product trends
Offering customers digital services that can be scaled across manufacturing portfolio
Improved cross-team collaboration - UXR, Design Ops, Product Management and Data Science
Exploration and experimentation to drive customer value
Improved customer journeys across existing digital channels
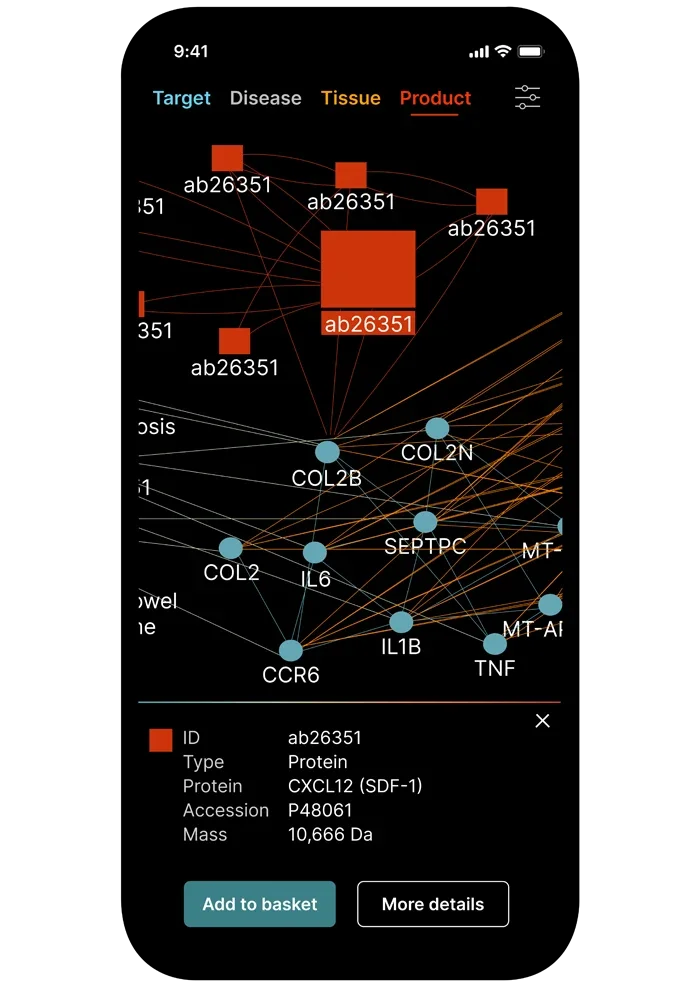
Associated products - Introducing purchasing
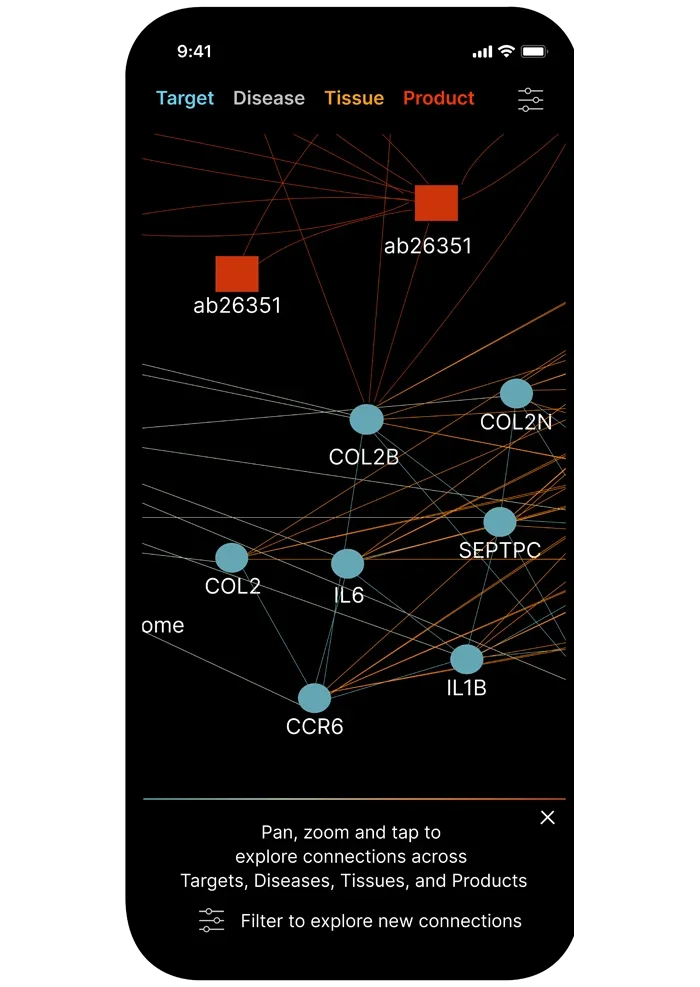
Interaction: Explore pathway data across the UI
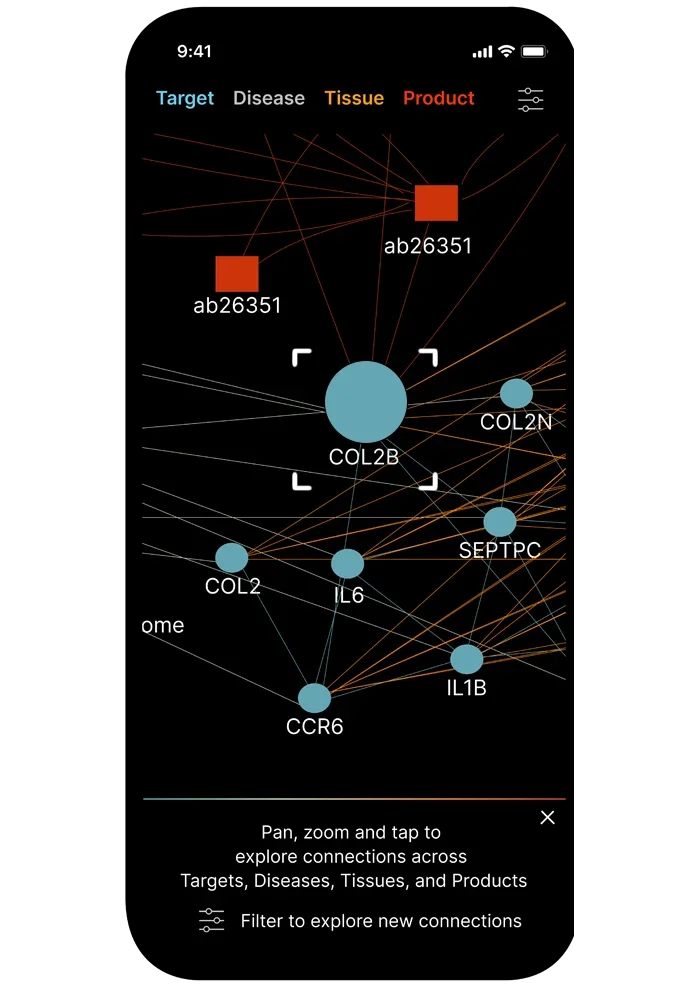
Auto-centre on attributes of interest
Research & discovery
“Future opportunities for experience improvements and growth are often found in existing customer feedback data”
Methods
Mapping existing search journeys and behaviours
Designing new flows - from existing to new capability
Simplification of early prototypes
Evaluating internal and external data sources:
PubMed, product reviews, UniProt database
Assessing end-to-end journey and complexity as a digital search experience
Feedback sessions on both tool capability and the journey flow
Design approach & solution exploration
Concepts & prototyping
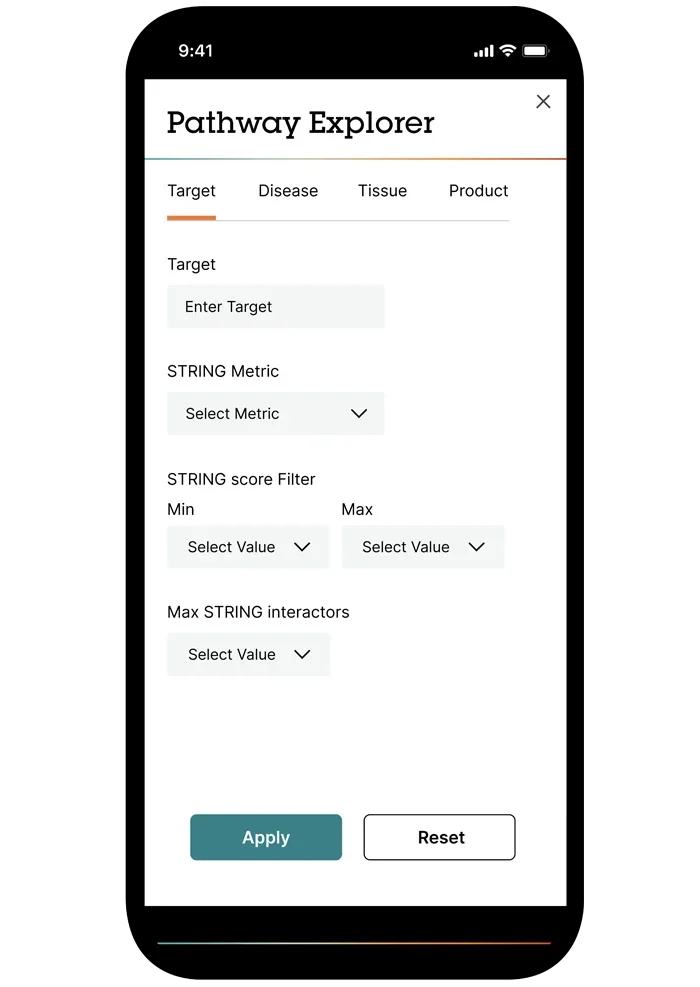
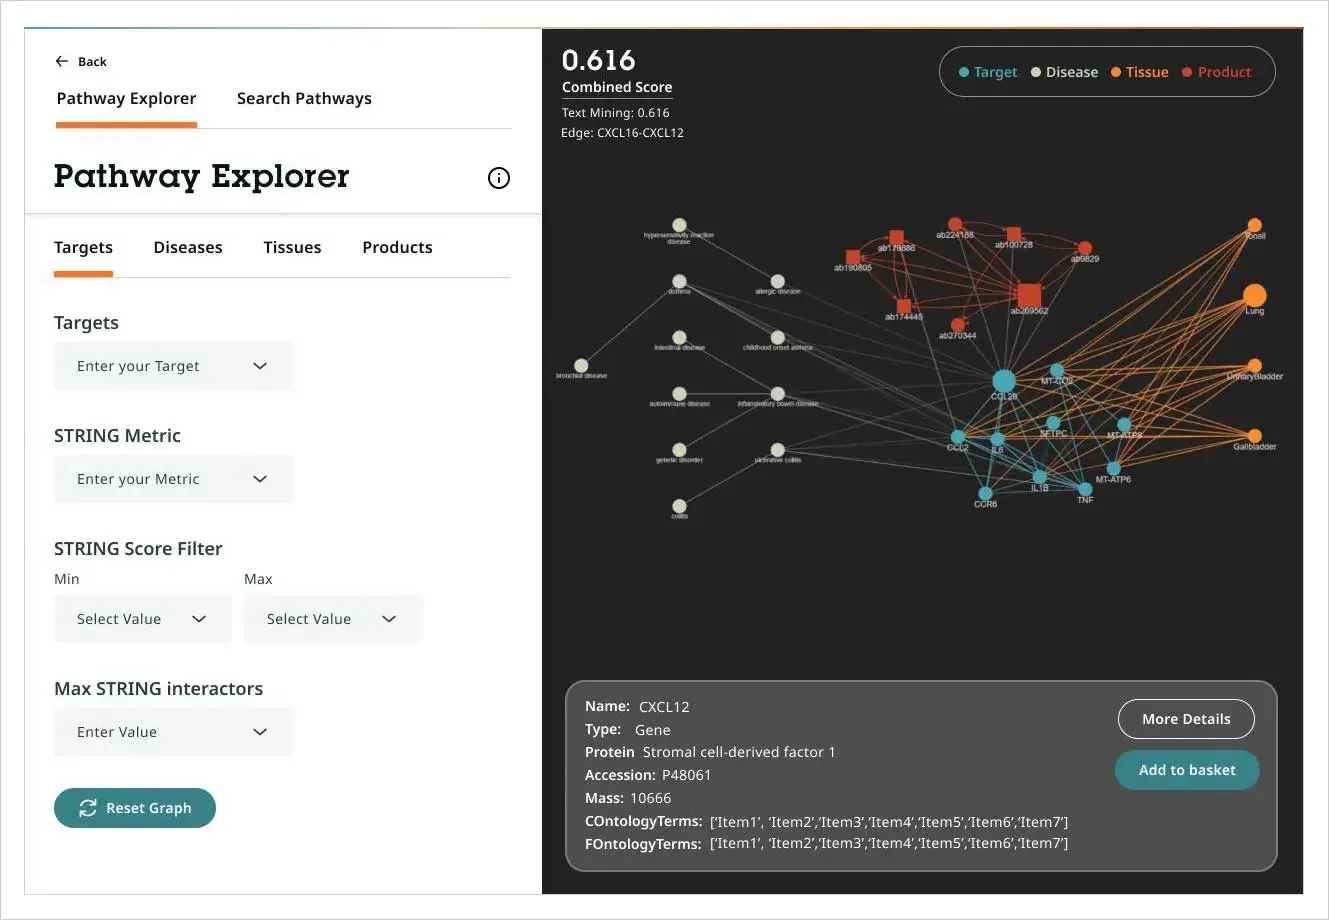
Simplification to minimum required UI input to return results - encouraging easy adoption
Potential to upscale and build upon results with further inputs for complex models
User flows: AI tools, landing pages, product quick view, purchasing journey
Iterations & Trade-offs:
Speed & stability: critical to adoption, any delays risked abandonment
Novelty: new interaction patterns created friction, so required careful onboarding
Complexity: risk of overwhelming users with too many options - we knew from existing search journeys many filters and options were left unused

All gestures across active Graph UI
Next stage: Simplification of complex terminology
Results
Researchers valued exposure to associated pathways not previously considered
≈ 75% average reduction in planning time / (From ~3 weeks → ~3–5 days)
Faster experiment planning compared to multi-source manual approach
Business Impact (Pre-release)
Demonstrated potential to shift from reactive product launches to proactive, trend-aligned portfolio planning
Positioned AI/ML as an enabler of digital-first discovery experiences
Learnings & next steps
Successes
Revealed deeper connections between experiment attributes - becoming an ‘advanced search’ alongside universally accepted method of e-commerce product search
Exposing customers to adjacent research opportunities helping them discover optional or future experiment potential
Demonstrating feasibility of predictive journeys within existing channels
Challenges & Learnings
Risk of friction if introduced as sole way to discover products, would need to compliment existing capability with option to explore deeper associations
Next Steps
Work with PM & Marketing on position as planing tool
Identify optimal positioning, exploring planning phase content journeys over search
Small scale testing in live environment
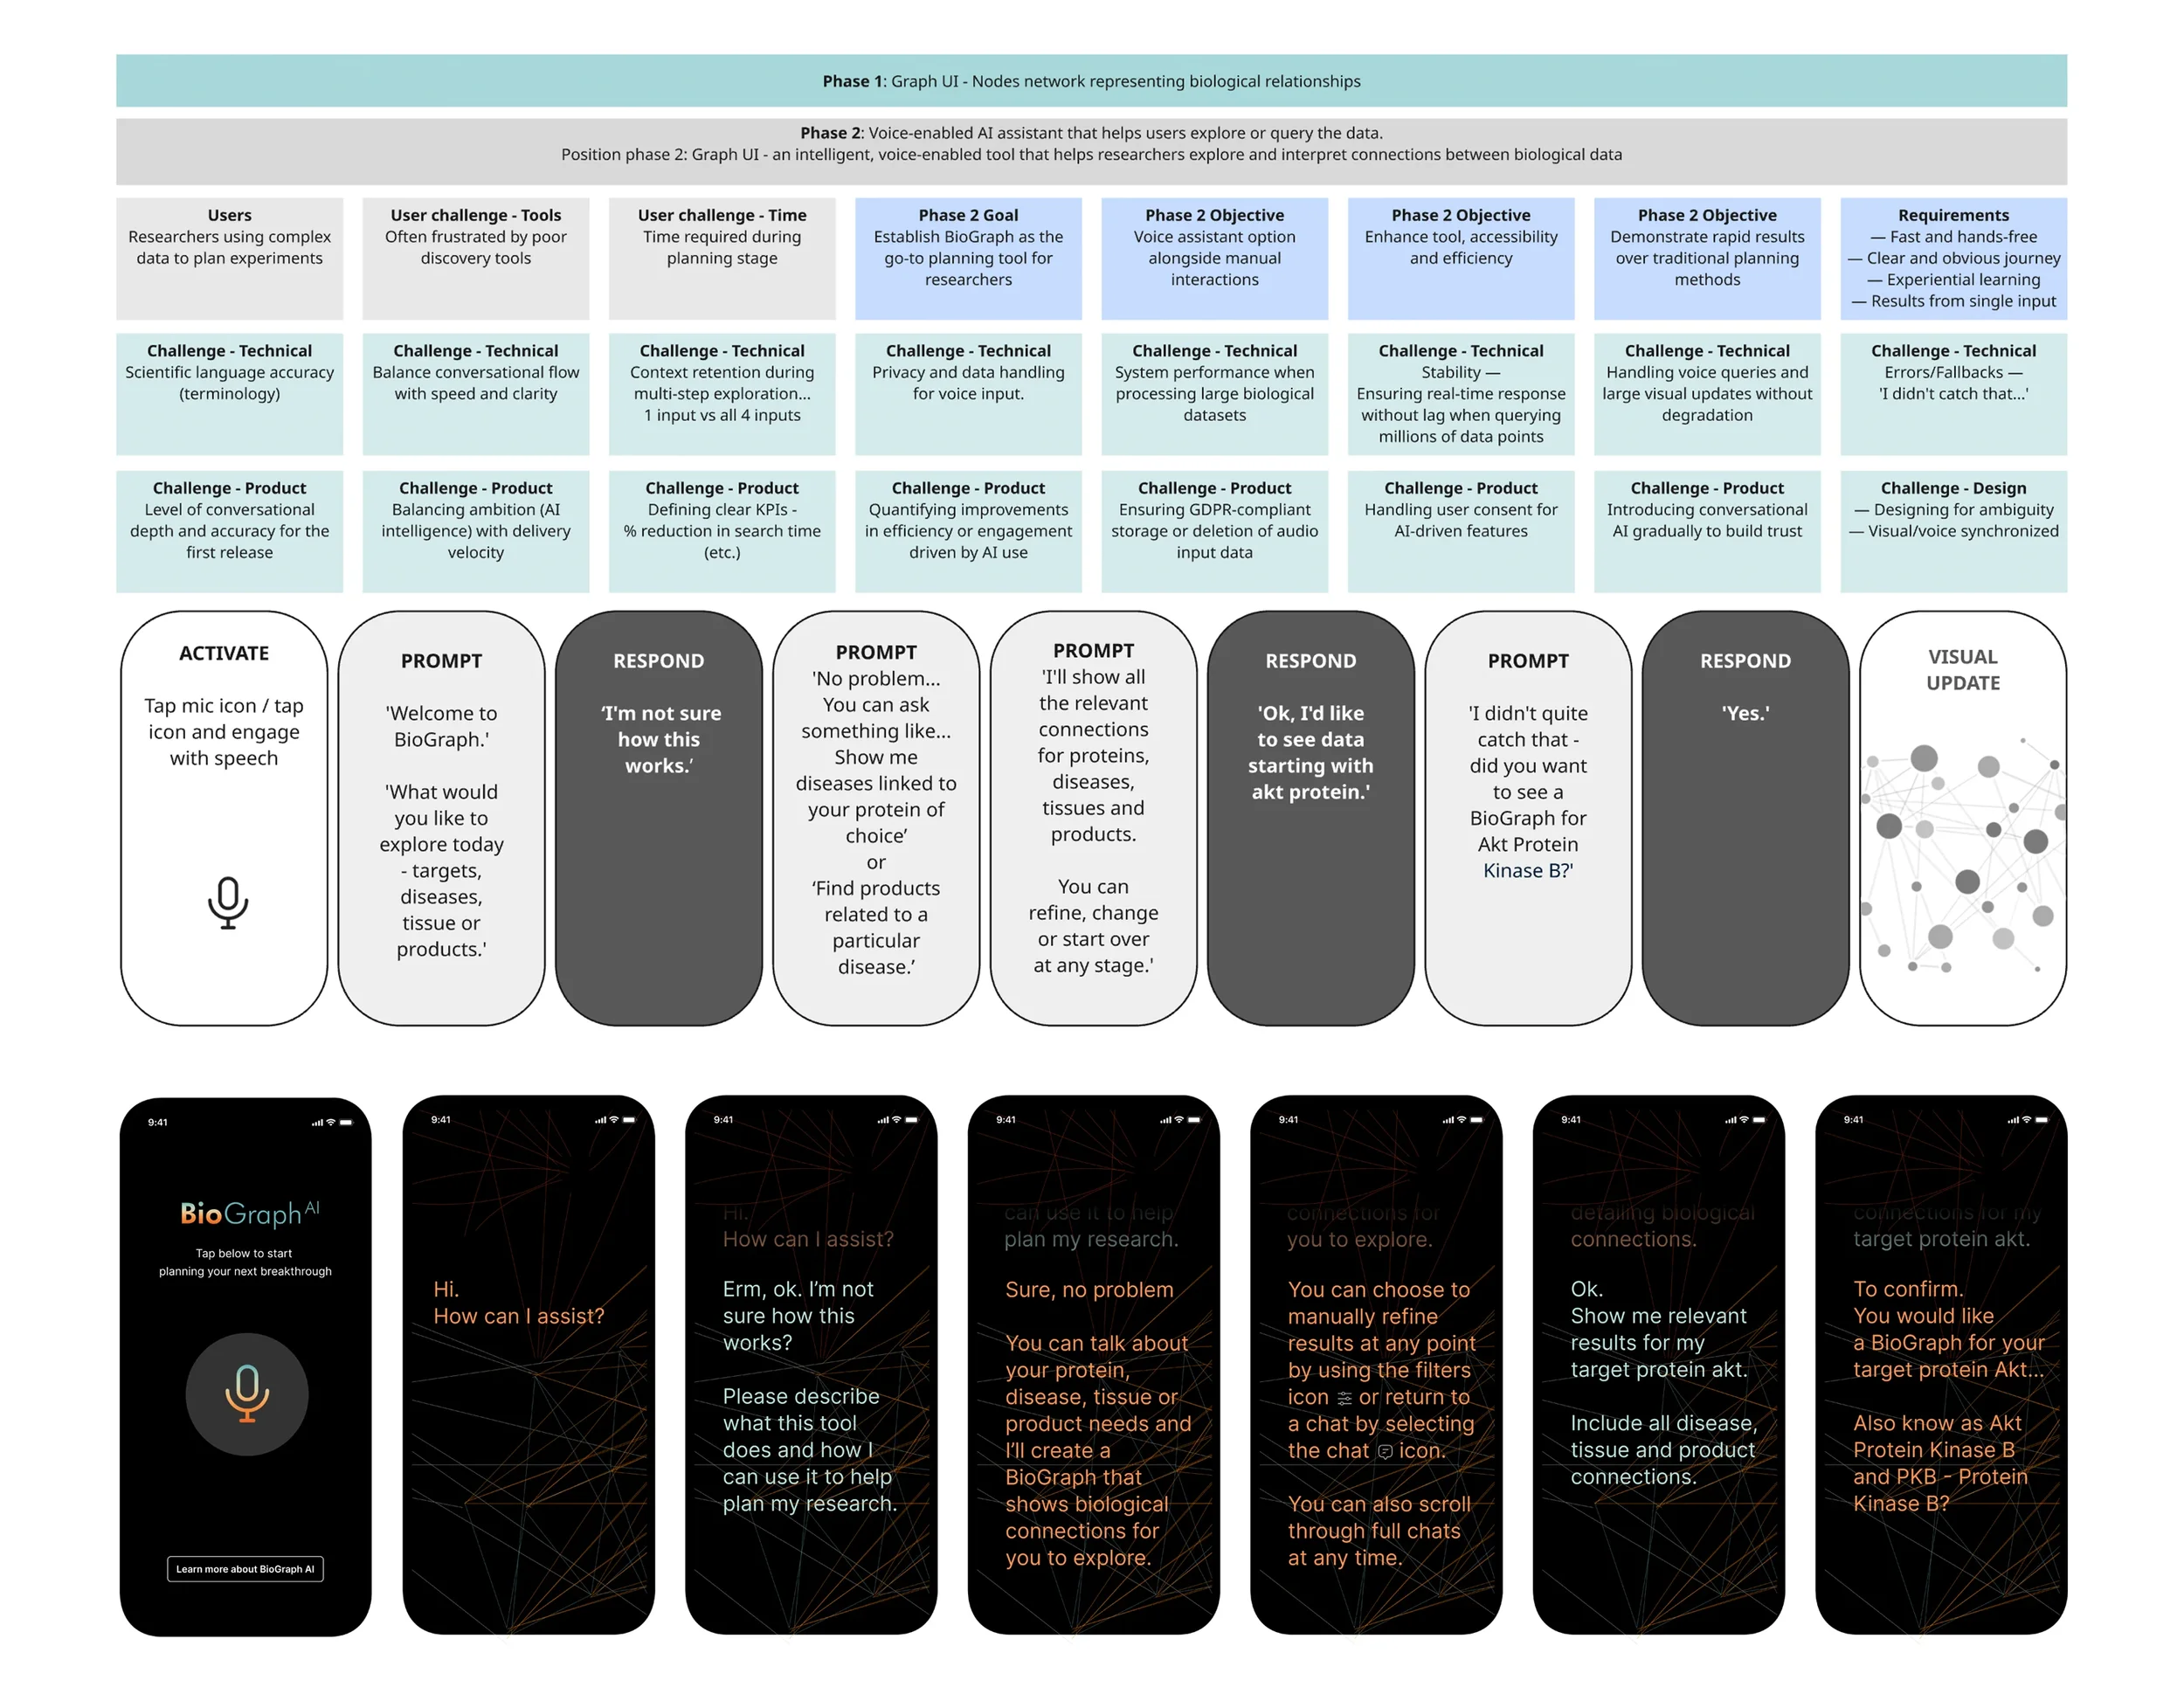
Explore Phase 2: AI Assisted interactions / Voice over manual
Early POC
Early desktop concept